Home / Data stories / Land, sea and sky
Land, sea and sky
When Did Your Town Last See a Total Eclipse?
Every path of totality across Britain and Ireland from AD 1000 to 2200, tested for 17,103 places: for most towns the last was in 1715 or 1724.
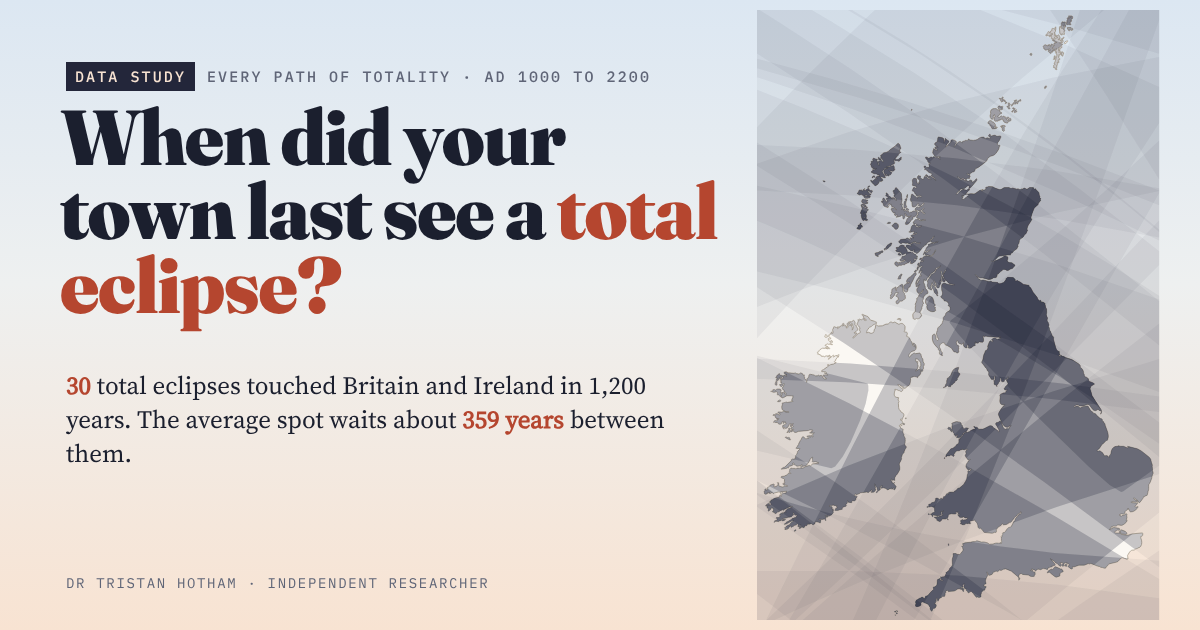
This is an interactive data study by Dr Tristan Hotham, built from open data. The map runs in your browser: explore it, search for places and switch layers. The write-up explains the method and what the data shows, and the data and code are open for anyone to reuse.
More in Land, sea and sky
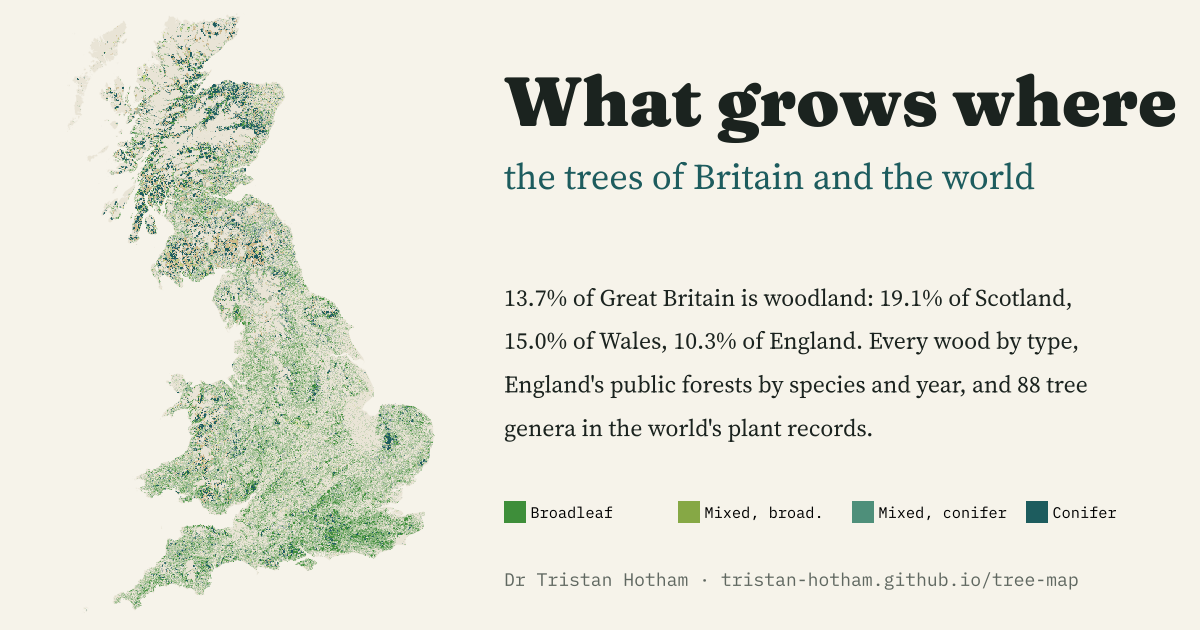 What Grows WhereEvery wood in Great Britain by type, England's public forests by species and planting year, and 88 tree genera worldwide: woodland covers 13.7% of Great Britain, 19.1% of Scotland but 10.3% of England.
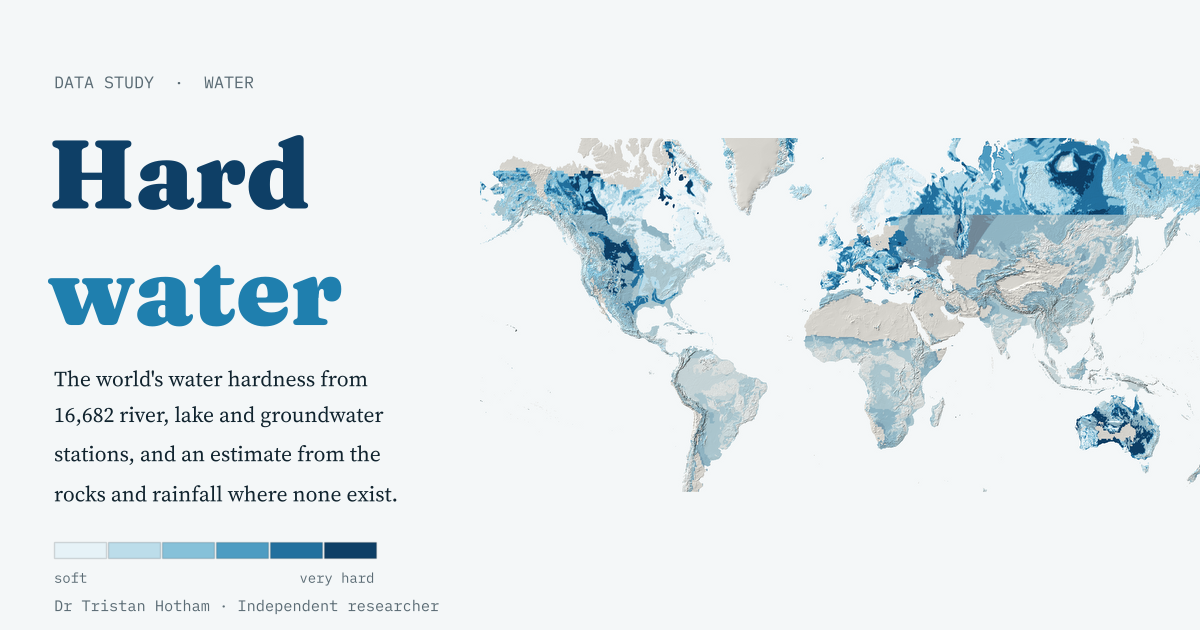 Hard WaterWater hardness from 16,682 river, lake and groundwater stations, and a simple model that guesses it from the rocks: Scandinavia's median is 14 mg/l, the Yucatán's 514.
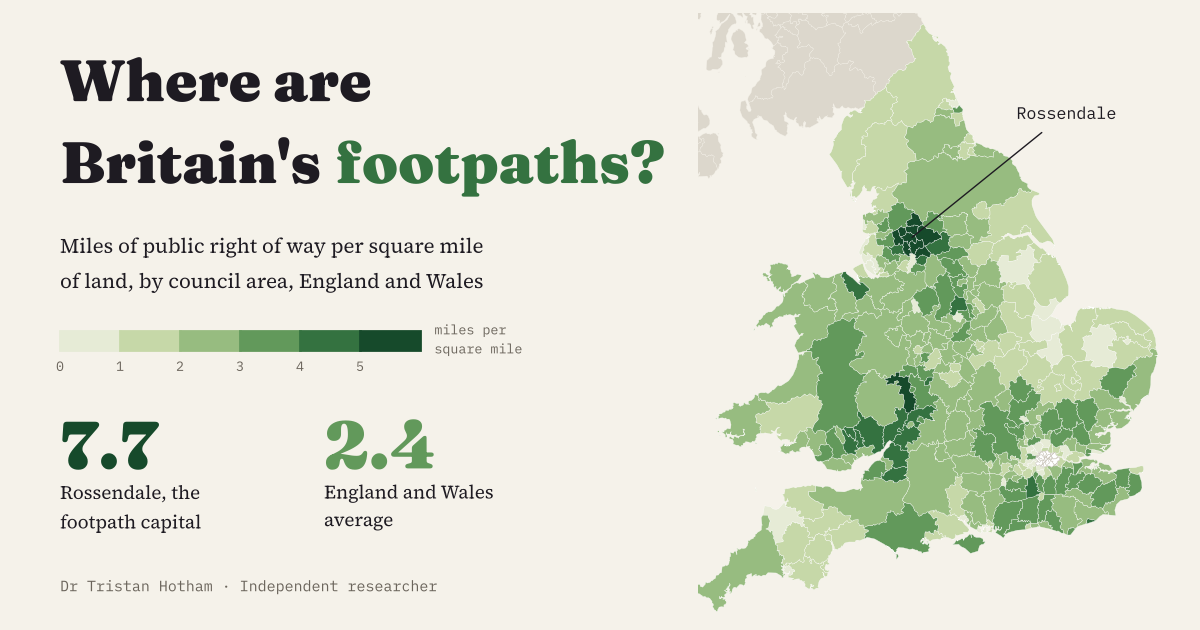 The Footpath CapitalEvery council in England and Wales by miles of public footpath per square mile: Rossendale tops it at 7.7, and the South Pennine mill towns fill the top ten.
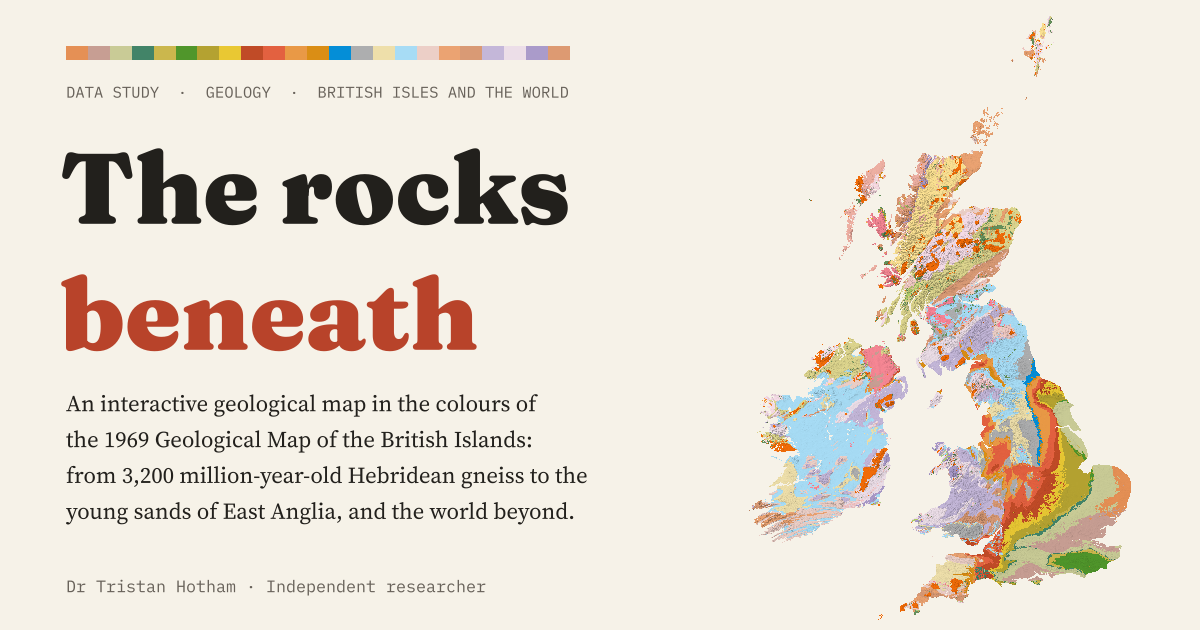 The Rocks BeneathA geological map of the British Isles and the world in the colours of 1969: Carboniferous rocks cover 17.5% of Great Britain, and England's layers get younger all the way to London.
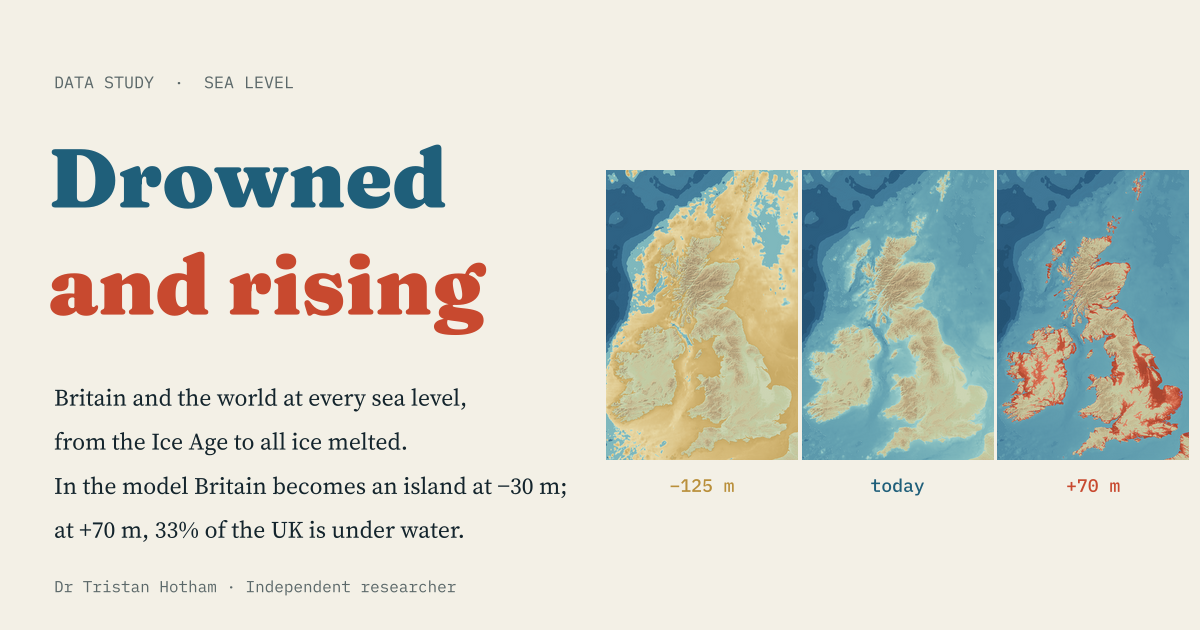 Drowned and RisingA bathtub model of every sea level from the Ice Age to an ice-free world: Britain becomes an island at −30 m, and at +70 m a third of the UK is under water.
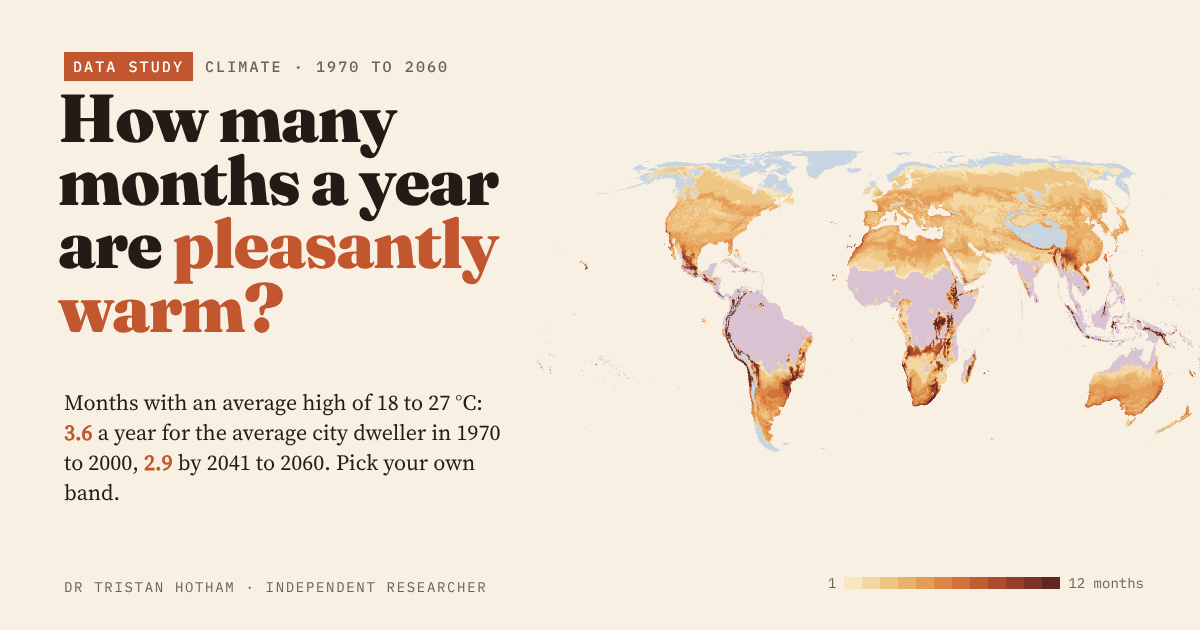 How Many Months Are Pleasantly Warm?Months with afternoon highs of 18 to 27 °C: the average city dweller gets 3.6 a year now and 2.9 by 2041 to 2060. Pick your own band.